
During the COVID-19 pandemic and after the pandemic ended, all the news outlets broke the news of the ‘California Exodus‘ to refer to the mass migration of California residents to other states in the USA, specifically Texas state. Did that really happen? Or was it just hype by news outlets?
In this article, let us look at the H1B Labor Condition Application(LCA) and Green Card PERM Labor Certification(LC) data provided by the US Department of Labor to verify if this is true with specialized skill set residents.
Article Contents
Timelines and H1B LCA, PERM Data Considered
In the article, we will use the US Dept of Labor’s H1B LCA and PERM data sets from the below Fiscal Years (FY):
- FY 2019 data – October 2018 to September 2019
- FY 2020 data – October 2019 to September 2020
- FY 2021 data – October 2020 to September 2021
- FY 2022 data – October 2021 to September 2022
- FY 2023 data – October 2022 to March 2023 (only till Q2)
COVID timelines as per the CDC website is
- March 2020 – July 2022
Total number of H1B LCAs in California by Fiscal Year
| FY 2019 | FY 2020 | FY 2021 | FY 2022 | FY 2023 (till Q2) |
| 127,945 | 110,037 | 107,416 | 119,229 | 48,818 |
Below is a graph of the above data plotted to understand the trend.
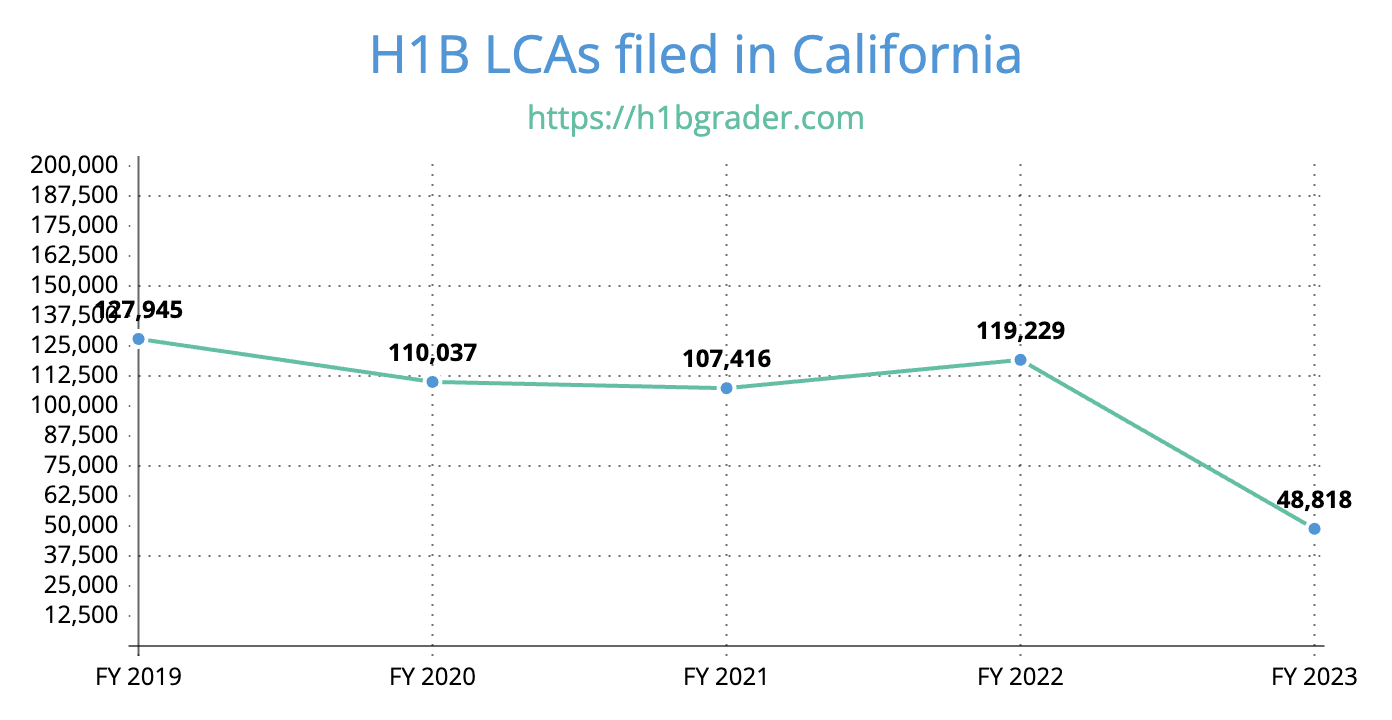
If we look at the above data in the table/chart closely, it is evident that the number of LCAs filed during the COVID period remained more or less the same during and after COVID.
You can check out the full list of H1B Sponsors in California State ordered by highest LCAs filed by a company.
Total number of H1B LCAs in Texas by Fiscal Year
| FY 2019 | FY 2020 | FY 2021 | FY 2022 | FY 2023 (till Q2) |
| 65,788 | 57,076 | 59,006 | 83,339 | 28,886 |
Below is a graph of the above H1B LCA data in Texas, which is plotted to understand the trend.
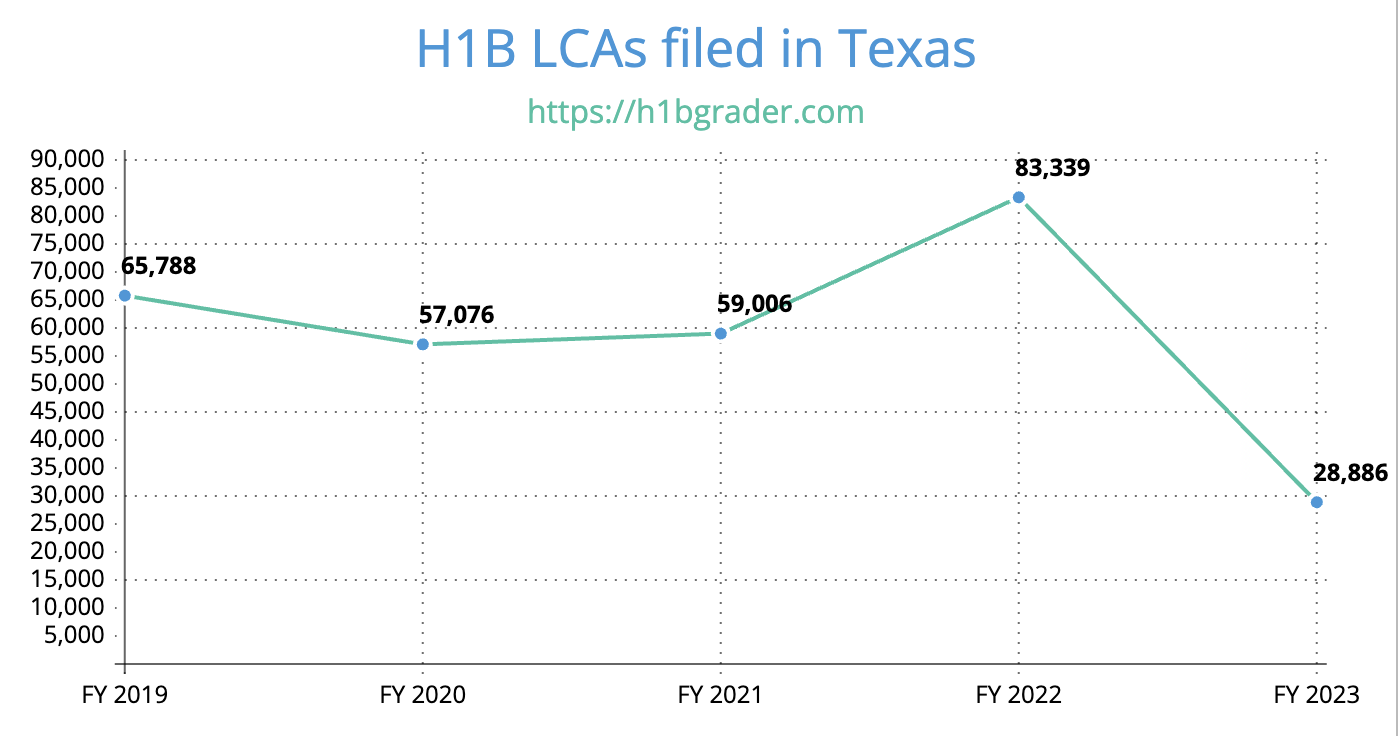
If we look at the above data table/chart for Texas, we can observe that there has been an increase in the number of LCAs filed in Texas for FY 2022. However, this trend seems to be in line with California State as well.
You can check out the full list of H1B Sponsors in Texas State ordered by highest LCAs filed by a company.
Now, let’s look at the Green Card related PERM LC Data from both the states.
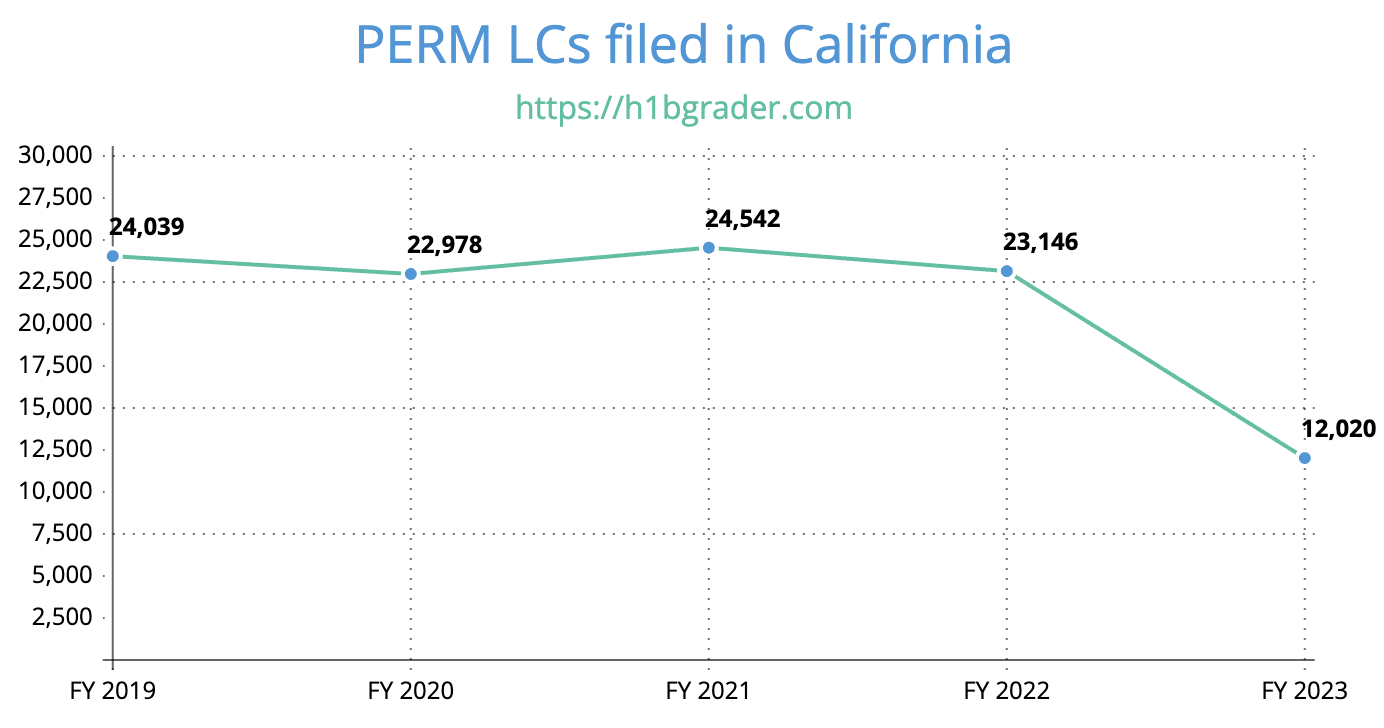
Green Card PERM LCs filed in California by Fiscal Year
| FY 2019 | FY 2020 | FY 2021 | FY 2022 | FY 2023 (till Q2) |
| 24,039 | 22,978 | 24,542 | 23,146 | 12,020 |
Below is a graph of the above Green Card PERM LC data for California, which is plotted to understand the trend.
Now, let’s look at Texas Data
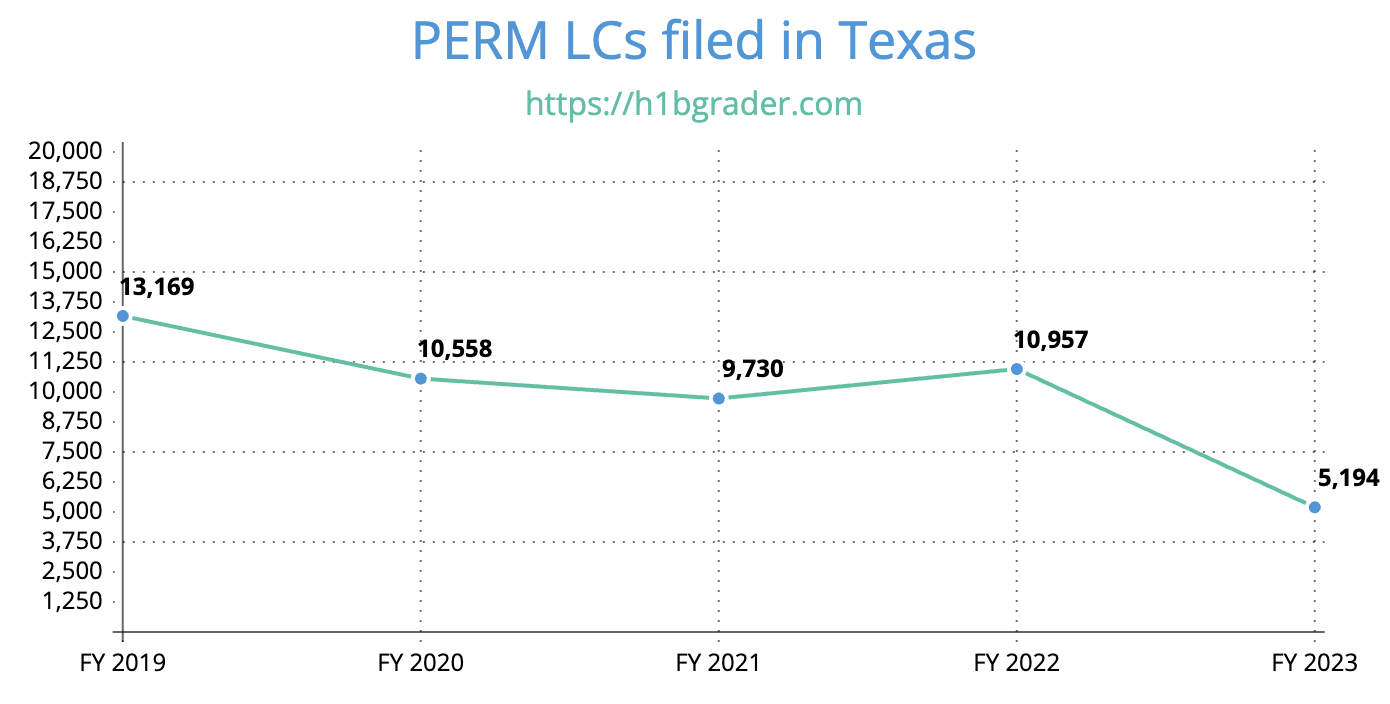
Green Card PERM LCs filed in Texas by Fiscal Year
| FY 2019 | FY 2020 | FY 2021 | FY 2022 | FY 2023 |
| 13,169 | 10,558 | 9,730 | 10,957 | 5,194 |
Below is a graph of the above Green Card PERM LC data for Texas, which is plotted to understand the trend.
You can view PERM LCs filed in a City for a Company using PERM LC Search options
Observations from above H1B LCA, PERM Data
- There is no real impact of COVID on the number of H1B LCA or PERM LC applications filed in California and Texas
- We do not see an apparent impression of technology(Tech) industry migration from California to Texas State. This may be due to the following reasons
- During COVID, quite a few employees might have moved to work from other states like Texas
- This may not have immediately triggered employers to amend/change LCAs, as DoL allowed remote work with loosened restrictions around MSA requirements
- As the COVID restrictions started easing out, more and more employers have called back their employees to return to the office
- Also, the data does not show a slowdown in hiring because of the recent layoffs. We may have to wait till full FY 2023 data is released to see the real impact of layoffs affecting immigrant workers
What do you think about these data points and insights? Share your inputs in the comments section below.